The 2017 CAN Dashboard provides an overview of the social health and well-being of Austin/Travis County and tracks our community’s progress in achieving four community goals:
- we are safe, just & engaged
- our basic needs are met
- we are healthy
- we achieve our full potential
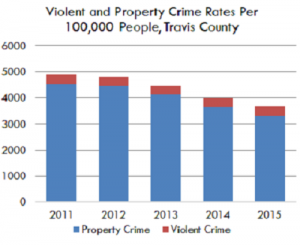
Are we achieving these goals? Over the coming weeks, I will review what the data show for each of these four goal areas. Today we take a closer look at safety, justice and engagement. The indicators selected to measure whether we are a community that is safe, just and engaged are the overall crime rate, whether people of different races are disproportionately booked into jail, and voting. There is good news for the crime indicator. Over the five years from 2011 through 2015, the crime rate in Travis County decreased by 25%. Both violent crime and property crimes declined.
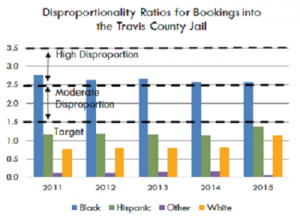
Arrest disproportionality has been stubbornly persistent for Black residents of Travis County. While Black residents account for 8% of the total adult population in Travis County, 21% of all people booked into the Travis County jail are Black. A recent report by the Urban Institute and the Center for Policing Equity finds that Black motorists are four-times more likely to be arrested after being stopped by the Austin Police Department as White motorists. This problem is not unique to our community, and solving it will require collaborative action.
An analysis of voting data from the last Presidential election shows that young people and people of color are least likely to vote. People who are White and older are most likely to vote. There is some good news with voting-more people voted in the 2016 presidential election than in the previous presidential election. Also, there was a 67% increase in the number of Hispanic voters in Travis County who participated in the election.
