Introduction
Central Health released an updated Demographic Report in September, 2020. The first Demographic Report was published in 2015, followed by a second report in 2017. This latest version innovates how Central Health gathers and utilizes data related to poverty, burdens of disease, and accessing care. It features improved data sources such as the Claritas Pop-Facts Premier database, which combines US Census Bureau American Community Survey (ACS) with other proprietary market data sources to provide estimates for the current year and allow analysis of historical poverty trends. These new data sources, combined with improved staff resources, resulted in new elements that were unavailable in previous reports.
Regional Poverty Trends & Projections
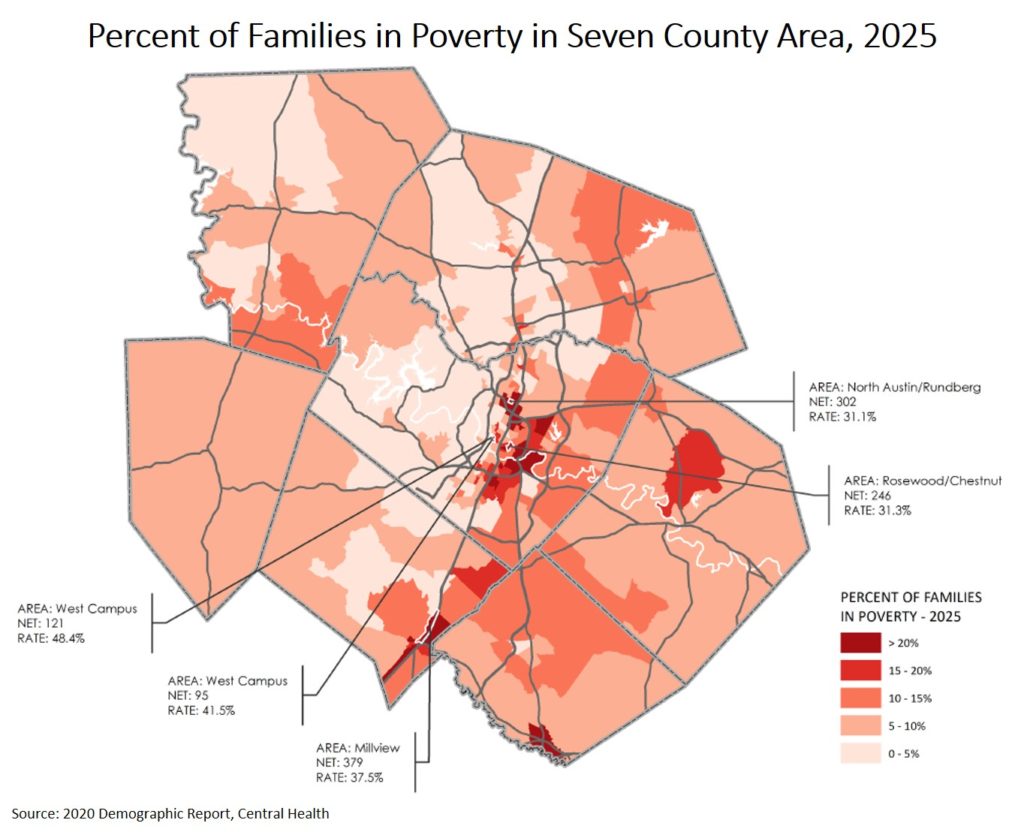
The report begins with a delineation of the general study area. To identify population and demographic trends in Travis County, researchers utilized census tracts. To better understand regional poverty dynamics, the report includes an analysis of Travis County and its six surrounding counties over the previous 20 years as well as projections to 2025. The seven-county area includes Bastrop, Blanco, Burnet, Caldwell, Hays, Travis, and Williamson Counties. The report tracks family poverty across the 7-county region from 2000 to 2020 and then projects the level of family poverty in the region in 2025 as shown in the below map.
Analysis of Poverty in Travis County
The service area for Central Health is Travis County, so the report then focuses-in on areas within Travis County that have the highest levels of family poverty. The “family poverty” measure utilized can be best understood by looking at the following poverty thresholds that are adjusted based on family size.
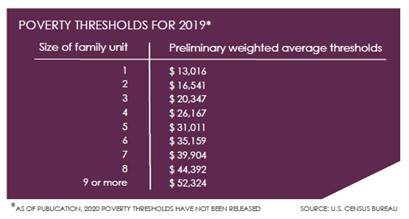
Families are defined as “two or more related people living together”. It was estimated that in Travis County in 2020, there are 291,881 families, of which 23,181 (or 8%) live in poverty.
Focus Areas
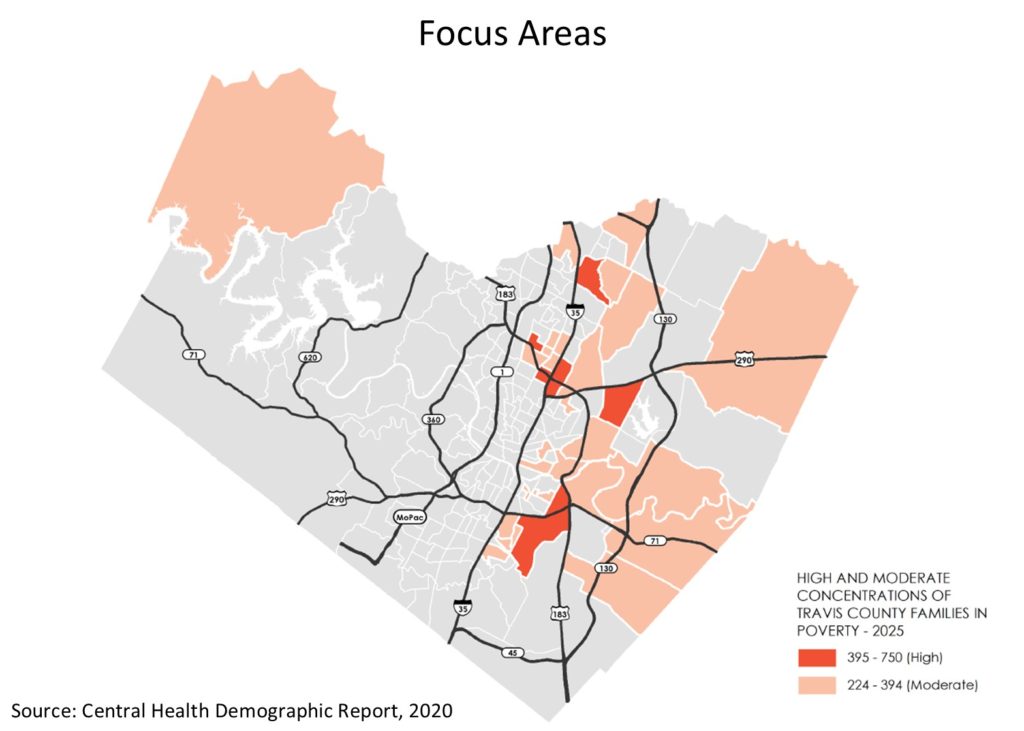
Central Health found 39 census tracts in Travis County projected to have high and moderate levels of family poverty in 2025. In the report, the tracts highlighted in the map below are divided into 12 focus areas for further analysis. The focus areas are Colony Park, Del Valle, East Central Austin, Hornsby Bend, Leander/ Lago Vista, Manor/Elgin, North Central Austin, North Travis County, Northeast Austin, Pflugerville, South Austin, and Southeast Austin.
The report provides current demographic characteristics for each focus area. It also: provides data analyzing the number of residents enrolled in Central Health programs and the number utilizing services through Central Health contracted providers; and compares the prevalence rate of chronic conditions; health insurance status; and households’ access to transportation of individual focus areas versus the overall rates for Travis County.
Highlights: Demographics
- Focus Areas Listed by: % of Population Younger Than 18 Years of Age – Del Valle (32.8%); Colony Park (32.6%); South Austin (32.4%); Hornsby Bend (32.2%); Manor/Elgin (32%); Northeast Austin (30.9%); North Central Austin (30.8%); Southeast Austin (30.3%); East Central Austin (29.8%); Pflugerville (28.8%); North Travis County (28.4%); TRAVIS COUNTY AVERAGE (24.1%); Leander/Lago Vista (22.7%)
- Focus Areas Listed by: % of Population 65 Years of Age and Older – Leander/Lago Vista (17.6%); TRAVIS COUNTY AVERAGE (11.1%); East Central Austin (9.6%); Pflugerville (8.8%); North Travis County (8.4%); Manor Elgin (7.7%); Northeast Austin (7.2%); Del Valle (7.1%); Hornsby Bend (7.0%); North Central Austin (6.8%); South Austin; (6.5%); Colony Park (6.0%); Southeast Austin (5.7%).
- Focus Areas Listed by: % Latino Ethnicity – South Austin (80.5%); Del Valle (73.5); North Central Austin (72.8%); Colony Park (69.3%); Southeast Austin (69.1%); Hornsby Bend (62.2%); Northeast Austin (58.8%); Manor/Elgin (48.8%); North Travis County (42.1%); TRAVIS COUNTY AVERAGE (34.7%); East Central Austin (34.7%); Pflugerville (26.4%); Leander/Lago Vista (14.3%).
- Focus Areas Listed by: % Black Population – Manor/Elgin (25.5%); Hornsby Bend (24.1%); Pflugerville (22.5%); Colony Park (22.0%); East Central Austin (16.4%); North Travis County (16.1%); Northeast Austin (14.4%); Del Valle (11.0%), Southeast Austin (9.9%); TRAVIS COUNTY AVERAGE (8.3%); South Austin (7.6%); North Central Austin (7.3%); Leander/Lago Vista (1.2%).
Highlights: Chronic Health Conditions
The prevalence rates in this section are calculated based on Central Health’s enrolled population and may not reflect total population prevalence of chronic conditions.
- Asthma – East Central Austin (6.2%); Leander/Lago Vista (5.3%); Hornsby Bend (4.7%); Southeast Austin (4.4%); TRAVIS COUNTY AVERAGE (4.4%); Northeast Austin (4.4%); South Austin (4.3%); Manor/Elgin (4.2%); Del Valle (4.1%); North Travis County (4.1%); North Central Austin (4.0%); Colony Park (4.0%); Pflugerville (4.0%).
- Behavioral Health – Leander/Lago Vista (20.9%); East Central Austin (19.6%); East Central Austin (19.6%); Southeast Austin (15.9%); South Austin (15.9%); TRAVIS COUNTY AVERAGE (15.4%); Del Valle (14.7%); Pflugerville (13.8%); Manor/Elgin (13.5%); Hornsby Bend (13.4%); North Travis County (13.2%); Colony Park (12.4%); North Central Austin (12.2%); Northeast Austin (11.9%).
- Diabetes – East Central Austin (15.1%); Leander/Lago Vista (14.8%); South Austin (13.8%); Hornsby Bend (13.0%); Del Valle (12.7%); Southeast Austin (12.2%); Pflugerville (11.9%); Manor/Elgin (11.2%); TRAVIS COUNTY AVERAGE (10.8%); North Travis County (10.1%); North Central Austin (9.7%); Northeast Austin (9.7%); Colony Park (9.5%).
- Heart Failure – Pflugerville (3.2%); Leander/Lago Vista (3.0%); East Central Austin (2.7%); Hornsby Bend (2.3%); Manor/Elgin (2.3%); TRAVIS COUNTY AVERAGE (2.2%); North Travis County (2.2%); South Austin (2.1%); North Central Austin (2.1%); Southeast Austin (1.9%); Northeast Austin (1.9%); Colony Park (1.9%); Del Valle (1.5%).
- Hypertension – East Central Austin (25.2%); Leander/Lago Vista (23.9%); Pflugerville (20.7%); South Austin (20.6%); Hornsby Bend (19.9%); Del Valle (19.6%); TRAVIS COUNTY AVERAGE (18%); Manor/Elgin (18%); Southeast Austin (17.8%); North Travis County (17.4%); Northeast Austin (15.5%); Colony Park (15.4%); North Central Austin (14.6%).
The report provides a similar breakdown for the following chronic health conditions: COPD (Chronic Lung Disease); Malignant Neoplasm (cancerous tumor); and Renal Failure.
Highlights: Health Insurance Access & Transportation Access
- Health Insurance Access (Households with Health Insurance) – Southeast Austin (73%); North Central Austin (75.6%); Northeast Austin (75.7%); Colony Park (77%); South Austin (77.7%); East Central Austin (77.8%); Del Valle (79.2%); Hornsby Bend (79.9%); TRAVIS COUNTY AVERAGE (79.9%); Manor/Elgin (80%); North Travis County (80.2%); Pflugerville (82.4%); Leander/Lago Vista (84.3%).
- Transportation Access (Households without a Vehicle) – North Central Austin (283); Southeast Austin (273); Northeast Austin (258); East Central Austin (254); Pflugerville (180); Leander/Lago Vista (160); South Austin (145); North Travis County (133); TRAVIS COUNTY AVERAGE (125); Colony Park (115); Del Valle (45); Manor/Elgin (39); Hornsby Bend (12).
Importance of Central Health’s 2020 Demographics Report
The report outlines findings for each of the 12 focus areas and the combined focus areas based on a comparison to outcomes for Travis County overall. The many useful maps, charts and data sheets for each of the 12 focus areas that are included in the report provide a very detailed snapshot of each individual area. Such information is critically important at this particular moment given the disparate health and economic impacts stemming from the pandemic. If we know where specific needs are concentrated, then we must look at all of the data available and collect data about what we don’t know about areas of concentrated need to: tailor a more effective response; and ensure more equitable outcomes for low-income communities and communities of color.