.
This is the second blog taking a closer look at Travis County’s new “Focus on Poverty” report. In the first blog, we compared poverty rates in Travis County to other counties in Texas and also looked at the demographic breakdown of those in poverty considering race, ethnicity, age and disability status. Today, we will take a closer look at the second half of the report, which compares poverty by household type, nativity, education level and geography.
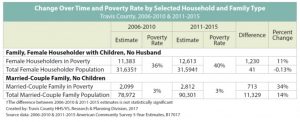
The Census Bureau defines a household as a set of individuals who live in one housing unit. Family households include people who are related by birth, marriage or adoption. Non-family households include those who live alone or with unrelated people. Single moms have the highest poverty rate for all household types. Forty-percent of family households headed by a woman with children and no husband live below the federal poverty level, which is $19,096 for one adult with two children. While poverty rates overall have declined, the poverty rate for these families has increased by 11% over the past 5 years. Households with the lowest poverty rate are married couples with no children.
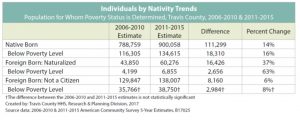
A little over 180,000 people in Travis County were living below the federal poverty level in 2015. Three-fourths of them were born in the United States and 22% (38,750) were foreign born non-citizens.
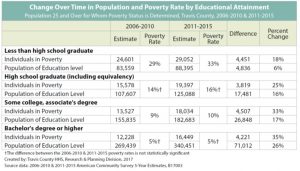
In looking at education and employment for those living in poverty, it may not be a surprise that one-third of all people with less than a high school education live in poverty, compared to only 5% of those with a bachelor’s degree or higher. However, it may be a surprise to some that a majority of Travis County residents over the age of 16 who were living below the poverty worked either full-time (12%) or part-time (43%), and 45% did not work.
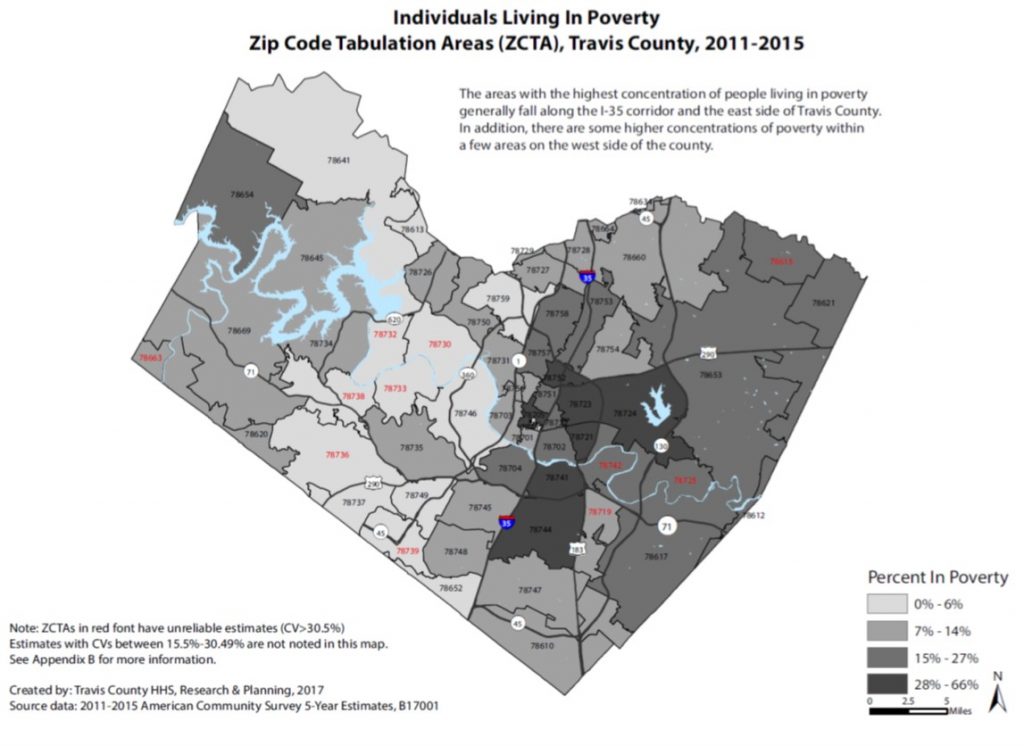
Finally, the report considers where poverty is being experienced in our community. Zip codes with poverty rates above 28% are: 78705, 78721, 78723, 78724, 78742, 78744, 78751, 78752, 78753, 78757, and 78758.
The Research Team at Travis County Health and Human Services has done a great service to our community in producing this report. Their in-depth analysis of the Census Bureau’s American Community Survey data help us get a better picture of poverty in our community. Visit the Travis County Health and Human Services website to find this and other publications.